HAZOP, HIRA, LOPA and FMEA
Choose the right risk method and turn failure analysis into operational decisions.
These methods answer different questions. HIRA screens hazards across an activity or site, HAZOP explores process deviations, LOPA tests whether independent protection layers reduce a defined scenario to a tolerable level, and FMEA anticipates how a product, asset or process can fail.
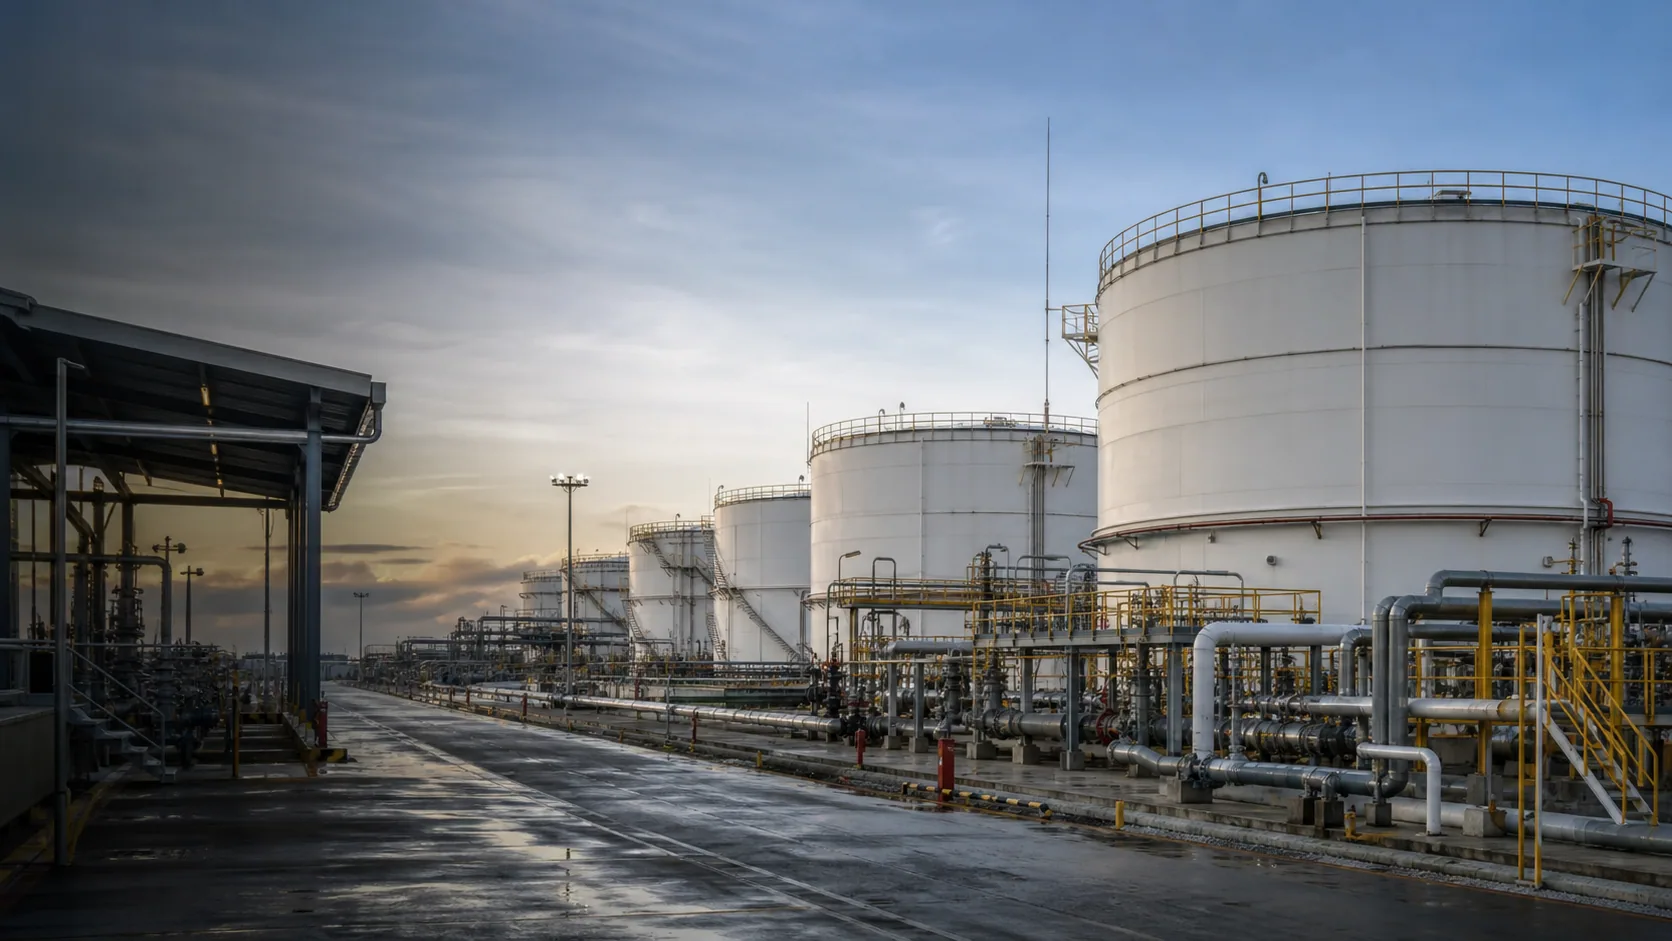
Illustration — industrial process context, not a Nordik client project.
What are the key differences between HAZOP, HIRA and LOPA?
They are complementary, not interchangeable. The right sequence depends on the decision to be made and the maturity of the available information.
What hazards exist, who or what is exposed, and is the current risk acceptable?
Broad and usually qualitative or risk-matrix based. Applicable to tasks, areas, projects and changes.
Hazard register, risk rating, existing controls and action plan.
How could each parameter deviate from design intent, why, and with what consequences?
Structured, multidisciplinary and guide-word based. Applied node by node to processes, systems or procedures.
Deviation scenarios, causes, consequences, safeguards and recommendations.
For one cause-consequence scenario, are the independent protection layers sufficient?
Semi-quantitative. Combines initiating-event frequency with the probability of failure of auditable independent protection layers.
Mitigated scenario frequency, risk-gap decision and any need for additional protection.
The practical distinction
HIRA gives breadth
Use it to establish the risk landscape and prioritise where deeper analysis is warranted.
HAZOP gives scenario depth
Use it when design intent, operating parameters and process interactions need systematic challenge.
LOPA gives decision discipline
Use it after a scenario has been defined to test protection-layer adequacy against an agreed risk criterion.
How should the methods be combined?
Screen with HIRA
Map hazards, exposed groups, credible consequences and current controls.
Deepen with HAZOP
For priority process systems, generate detailed deviation scenarios and challenge safeguards.
Escalate selected scenarios to LOPA
Analyse scenarios whose severity, uncertainty or safeguard dependence requires a semi-quantitative decision.
Use FMEA where failure logic matters
Analyse equipment, design or process failure modes and convert priorities into engineering, maintenance or quality actions.
A risk matrix does not replace HAZOP detail, and a safeguard named in HAZOP is not automatically an independent protection layer. LOPA credit requires independence, functionality, integrity, reliability and auditability.
How does FMEA help reduce operating costs?
FMEA does not create savings by itself. Savings come from implementing and verifying the actions selected through the analysis.
Avoid unplanned downtime
Identify dominant failure modes early and remove causes or detect degradation before functional failure.
Target maintenance effort
Link maintenance tasks and intervals to credible failure modes instead of applying the same routine to every asset.
Reduce scrap and rework
Strengthen process controls where causes can create defects, instability or repeated non-conformities.
Optimise spares and inspections
Prioritise critical components, inspection points and useful condition data instead of accumulating undifferentiated stock and checks.
Lower late-change costs
Correct weak design choices while modification is still easier and less disruptive than after commissioning.
Improve root-cause learning
Maintain a living analysis that incorporates incidents, maintenance history and design or operating changes.
What are the seven essential FMEA steps?
This seven-step structure aligns the analysis from preparation through documented decisions and follow-up.
Planning and preparation
Define the objective, scope, boundaries, assumptions, team, schedule, available data and acceptance rules.
Structure analysis
Break the system or process into levels and interfaces so every analysed item has a clear place and boundary.
Function analysis
State what each item or process step must do, for whom, under which conditions and with which measurable requirements.
Failure analysis
Identify failure effects, failure modes and causes, then connect how failures propagate locally and through the system.
Risk analysis
Evaluate severity, occurrence and detection using defined scales and current controls. Prioritise with the chosen method; do not rely blindly on an RPN.
Optimisation
Select actions that eliminate causes, reduce occurrence or improve detection. Assign owners and dates, then reassess residual risk.
Results documentation
Record decisions, evidence, unresolved high risks and lessons. Approve the analysis and keep it current through change management and operating feedback.
Worked example: process pump availability
The example is illustrative. Rankings and actions must be adapted to actual duty, data and risk criteria.
Transfer product at required flow
Insufficient or no flow
Production interruption and possible process instability
Cavitation caused by low suction margin or a blocked strainer
Monitor suction conditions, verify the operating envelope, improve strainer inspection and investigate recurring low-pressure events
The value is not the worksheet itself. The value is the decision chain: function → failure → effect → cause → control → accountable action → verified result.
Common pitfalls to avoid
Starting with a pre-filled spreadsheet before defining scope and functions
Confusing failure mode, cause and effect
Using an RPN threshold as the only prioritisation rule
Ignoring high-severity items because occurrence is judged low
Listing training as the default action when engineering controls are feasible
Closing actions without implementation and effectiveness evidence
Failing to update the FMEA after incidents, modifications or new operating data
Structure your next risk study
Nordik can support study preparation, multidisciplinary workshops, scenario quality review, action governance and integration with operating and maintenance systems.